Unlocking Insights: Mastering Measurement Scales in Research
Imagine trying to understand people's opinions about a new product without having a structured way to measure their responses. Or perhaps you're a researcher trying to quantify the effectiveness of a new teaching method. In both scenarios, you need a reliable system for collecting and analyzing data. That's where measurement scales in research come into play. These tools provide a framework for quantifying abstract concepts, opinions, and behaviors, transforming raw data into meaningful insights.
Think of measurement scales as the bridge connecting your research questions to tangible data points. Whether you're interested in understanding customer satisfaction, employee engagement, or the effectiveness of a marketing campaign, choosing the right measurement scale is crucial for obtaining accurate and insightful results.
This exploration delves into the world of measurement scales, providing a comprehensive understanding of their types, applications, and best practices. By the end, you'll be equipped with the knowledge to confidently select and implement the most appropriate scales for your research, leading to more impactful findings.
Let's start by unpacking the different types of measurement scales commonly used in research. These scales vary in their complexity and the type of data they yield. Some common types include:
- Nominal Scales: These scales categorize data into distinct groups or categories without any inherent order or ranking. Think of variables like gender, ethnicity, or car brands.
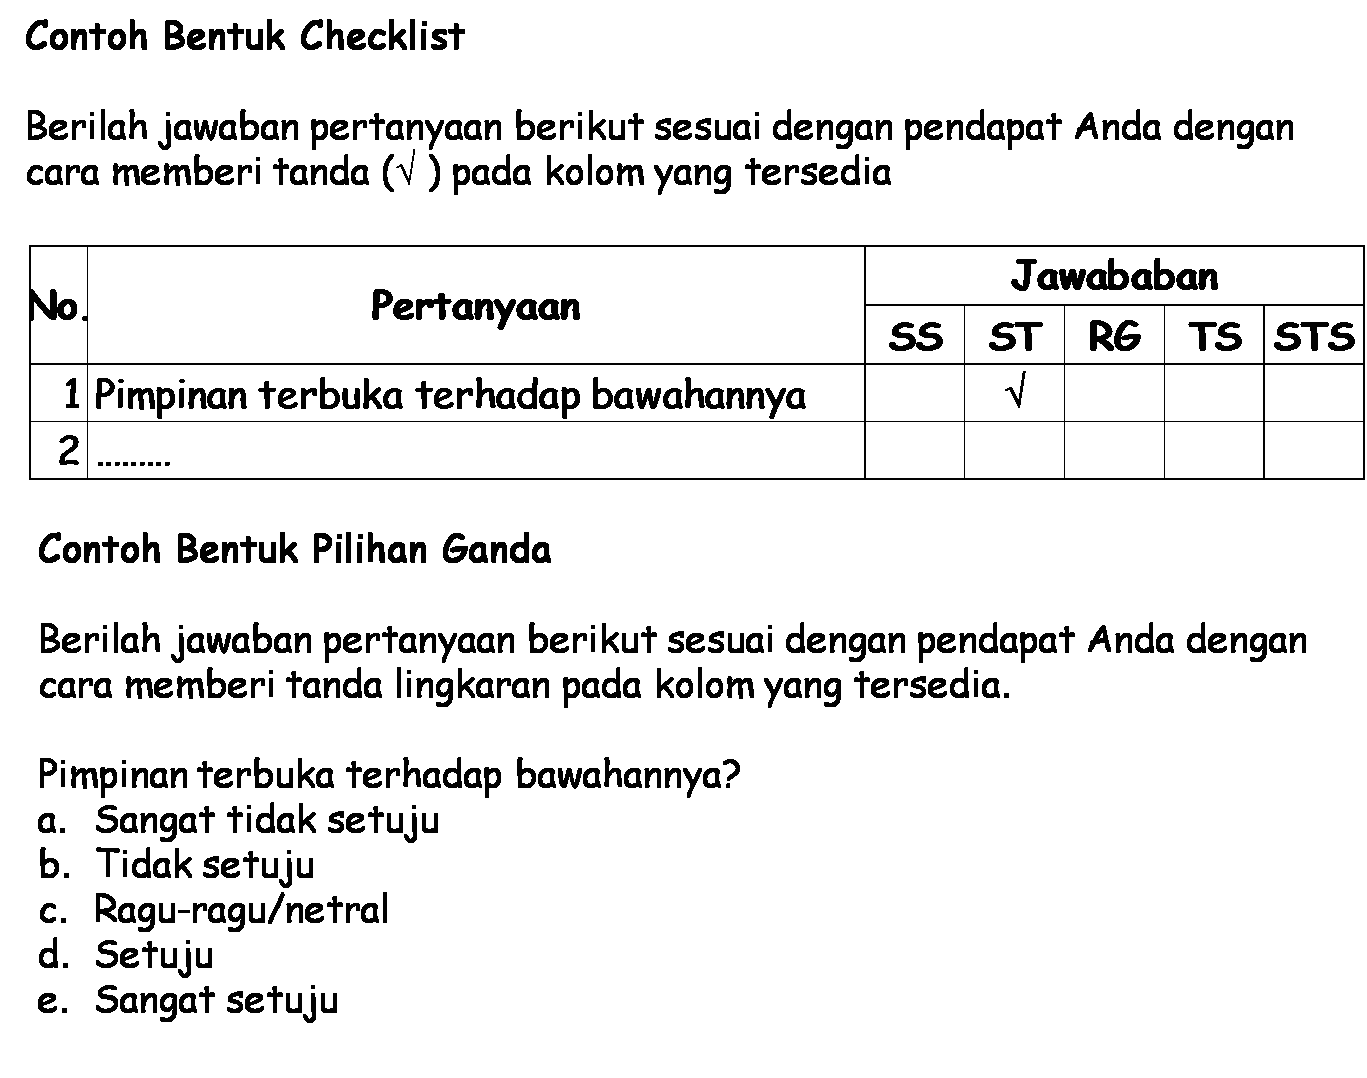
- Ordinal Scales: Ordinal scales introduce order and ranking to categories. Examples include educational levels (high school, bachelor's, master's) or levels of agreement (strongly disagree, disagree, neutral, agree, strongly agree).
- Interval Scales: Interval scales maintain order and equal intervals between data points but lack a true zero point. Temperature measured in Celsius or Fahrenheit is a classic example.
- Ratio Scales: Ratio scales possess all the characteristics of interval scales but include a true zero point, allowing for meaningful ratios. Examples include height, weight, or income.
Each scale type serves a specific purpose and dictates the types of statistical analysis that can be performed. Understanding these distinctions is essential for selecting the most appropriate scale for your research questions and ensuring the validity of your findings.
Now, let's consider a practical example. Imagine you're conducting research on customer satisfaction with a new software product. You could use a Likert scale, a type of interval scale, to measure satisfaction levels. The scale might range from "Very Dissatisfied" to "Very Satisfied," with each point on the scale assigned a numerical value. This approach allows you to quantify satisfaction levels and perform statistical analysis to identify trends and areas for improvement.
Mastering measurement scales in research empowers you to collect meaningful data that can drive informed decision-making. By understanding the nuances of different scale types and their applications, you'll be well-equipped to conduct impactful research across various fields, from marketing and psychology to healthcare and education.

contoh skala dalam penelitian | Kennecott Land

contoh skala dalam penelitian | Kennecott Land

contoh skala dalam penelitian | Kennecott Land

contoh skala dalam penelitian | Kennecott Land

contoh skala dalam penelitian | Kennecott Land

contoh skala dalam penelitian | Kennecott Land

contoh skala dalam penelitian | Kennecott Land

contoh skala dalam penelitian | Kennecott Land

Apa Itu Data Ordinal Dan Nominal | Kennecott Land

contoh skala dalam penelitian | Kennecott Land

contoh skala dalam penelitian | Kennecott Land

Jenis Variabel Dan Contohnya | Kennecott Land

contoh skala dalam penelitian | Kennecott Land

contoh skala dalam penelitian | Kennecott Land
contoh skala dalam penelitian | Kennecott Land