Unlocking Transformer Secrets: The No-Load Phasor Diagram Decoded
Ever wondered how a transformer hums to life even before powering your devices? The secret lies within the no-load phasor diagram, a visual key to understanding the fundamental behavior of these essential electrical components. This diagram isn't just a theoretical construct; it's a powerful tool for engineers and anyone curious about the magic behind electrical power distribution.
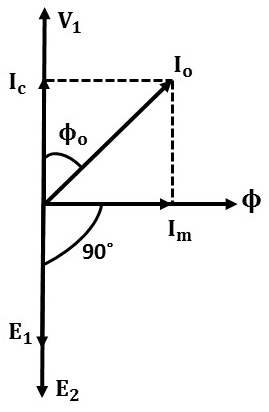
A transformer's no-load condition, meaning no load connected to the secondary winding, provides crucial insights into its core characteristics. The no-load phasor diagram graphically represents the relationship between the applied voltage, the magnetizing current required to establish the magnetic flux in the core, and the resulting flux itself. Understanding this interplay is paramount for optimizing transformer design and predicting performance.
The concept of phasor diagrams stems from the representation of sinusoidal alternating quantities as rotating vectors, or phasors. These phasors simplify the analysis of AC circuits, allowing us to visualize phase relationships between voltage and current. In the context of a transformer, the no-load phasor diagram specifically illustrates the behavior of the primary winding when the secondary winding is open-circuited.
Historically, the development of phasor diagrams coincided with the advancements in AC circuit theory pioneered by engineers like Charles Proteus Steinmetz. These diagrams became essential tools for analyzing and designing AC machinery, including transformers, enabling engineers to visualize and optimize their performance. The no-load phasor diagram, in particular, helps identify core losses and understand the magnetization characteristics of the transformer.
A typical no-load phasor diagram shows the applied primary voltage (V₁) as the reference phasor. The magnetizing current (Iₘ), which is responsible for establishing the magnetic flux (Φ), lags the voltage by almost 90 degrees due to the inductive nature of the core. A small component of the no-load current, representing core losses (Iᶜ), is in phase with the voltage. Understanding these relationships allows engineers to determine core loss characteristics, predict no-load current magnitude, and optimize transformer design for efficiency.
Benefits of understanding the no-load phasor diagram include: 1) Determining core losses: The diagram reveals the core loss component of the no-load current. 2) Predicting no-load current: It helps estimate the current drawn by the transformer even without a load. 3) Optimizing transformer design: Insights from the diagram aid in selecting appropriate core materials and minimizing core losses.
Creating a no-load phasor diagram involves representing the primary voltage, magnetizing current, and core loss current as phasors with their respective magnitudes and phase angles. The diagram visually demonstrates the lagging relationship between magnetizing current and voltage and the in-phase relationship between core loss current and voltage. For example, if the primary voltage is 120V and the no-load current is 1A with a power factor of 0.2, the diagram would show a voltage phasor of 120V, a magnetizing current phasor close to 1A lagging the voltage by nearly 90 degrees, and a core loss current phasor of 0.2A in phase with the voltage.
Advantages and Disadvantages of Using Phasor Diagrams
| Advantages | Disadvantages |
|---|---|
| Simplified visualization of AC quantities | Limited to sinusoidal waveforms |
| Easy understanding of phase relationships | Can become complex for large circuits |
FAQs:
1. What is a phasor? A phasor is a rotating vector representing a sinusoidal quantity.
2. Why does the magnetizing current lag the voltage? Due to the inductive nature of the transformer core.
3. What represents core losses in the diagram? The core loss current component (Iᶜ).
4. What is the significance of no-load condition? It reveals core characteristics and losses.
5. How does the diagram help in transformer design? It aids in optimizing core material and minimizing losses.
6. What is the typical phase angle between magnetizing current and voltage? Close to 90 degrees lagging.
7. What is the relationship between flux and magnetizing current? Flux is directly proportional to magnetizing current.
8. How does the phasor diagram relate to real-world transformer operation? It predicts no-load current and helps analyze transformer behavior.
Tips and Tricks: Remember that the magnetizing current is typically much smaller than the full load current. Also, accurate measurements are crucial for constructing a precise phasor diagram.
In conclusion, the no-load phasor diagram is a fundamental tool for understanding transformer behavior. It provides valuable insights into core losses, magnetizing current, and the relationship between voltage and flux. By mastering this visual representation, engineers can optimize transformer design, predict performance, and ensure efficient operation. Understanding the no-load phasor diagram unlocks the secrets of these essential electrical devices, paving the way for advancements in power systems and enabling the reliable delivery of electricity that powers our modern world. Take the time to explore further resources and delve deeper into this fascinating aspect of electrical engineering. Your journey into the world of transformers starts with the no-load phasor diagram.

Power Factor Correction Leading at Thad Bracamonte blog | Kennecott Land

Load Regulation Circuit Diagram | Kennecott Land

phasor diagram of transformer with no load | Kennecott Land

Transformer on No load | Kennecott Land

Circuit Diagram For Transformer | Kennecott Land

Connection Of Single Phase Transformer | Kennecott Land

No load Transformer and its phasor diagram | Kennecott Land

Induction Motor Phasor Diagram | Kennecott Land

Amazing How To Draw A Phasor Diagram For Transformer of the decade Don | Kennecott Land

Circuit Diagram Of Transformer On Load | Kennecott Land

Transformer ON Load Condition | Kennecott Land

DIAGRAM Electrical Transformer Phasor Diagram | Kennecott Land

Voltage And Current Phasor Diagram | Kennecott Land
Solved Draw the phasor diagram of single phase transformer at unity | Kennecott Land

Phasor Diagram Of Transformer On No Load | Kennecott Land